Features
Cash management and payments dashboard
Instant insights into your cash management and payments performance
The cash management and payments dashboard offers specific insights, at BIC8 level, into your correspondent banking performance derived from your Swift message data. It covers: Customer Transfers and Cheques (Category 1), Financial Institutional Transfers (Category 2) and Cash Management and Customer Status messages (Category 9).

6 analysis options
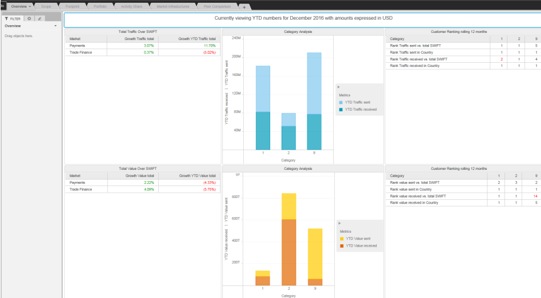
- Scope analysis shows your total volumes and values over Swift, their evolution and your ranking within your BIC8 country or compared to the Swift total
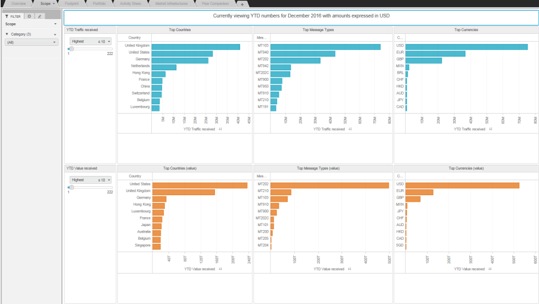
- Portfolio analysis helps visualise your data according to currency and message type
- Footprint analysis helps visualise your data according to region and country, displaying the data as an interactive map
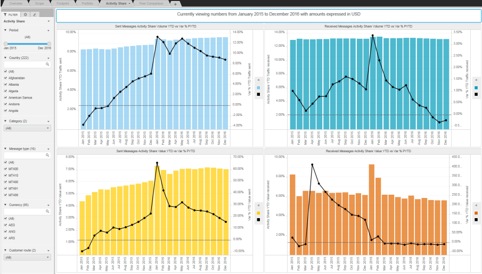
- Activity share analysis compares your data to the overall market
- You can also look at your activity with market infrastructures
- There’s also an option to view a comparison against an average peer group
Network management dashboard

Insights to help you monitor and improve your business and efficiency across your correspondent banking network
The Banking Insights network management dashboard offers specific insights, at BIC8 level, into the performance of your correspondent network, derived from your unique Swift message data.
The analysis is based on data for Customer Transfers and Cheques (Category 1); Financial Institutional Transfers (Category 2); Collections and Cash Letters (Category 4); Documentary Credits and Guarantees (Category 7) and Cash Management and Customer Status (Category 9) to evaluate the performance and efficiency of your own and your correspondents’ message processing.
Once you enter the network management dashboard within Banking Insights, simply select the analysis you require.
4 analysis options
- Scope analysis shows, at BIC8 level, your total volumes and values over Swift, organised by your top 25 correspondents and the evolution over time.
- Correspondents analysis displays a dynamic view on your top 75 correspondents in terms of volume and value. You can then select one correspondent and view the evolution of your relationship per country, currencies or type of messages.
- Portfolio analysis helps visualise your data according to currency and message type, as well as your top correspondents.
- Footprint analysis helps visualise your data according to region and country, displaying the data as an interactive map.
Trade finance dashboard
Get immediate insights into your trade finance performance
The Banking Insights trade finance dashboard provides specific insights, at BIC8 level, into your correspondent banking performance, derived from your unique Swift message data. It covers: Collections and cash letters (Category 4) Documentary credits (Letters of Credit) and Guarantees (Category 7).
Once you enter the trade finance dashboard within Banking Insights, simply select the analysis you require.

5 analysis options
- Scope analysis shows your total volumes and values over Swift, their evolution and your ranking within your BIC8 country compared to Swift totals.
- Portfolio analysis helps visualise your trade finance data according to currency and message type.
- Footprint analysis helps visualise your data according to region and country, displaying the data as an interactive map.
- Activity share analysis compares your data to the overall market.
- There’s also an option to make a comparison against an average peer group.

